

Professor Lang is a professor of economics at Salem State University. She has been teaching a course
Question:
Professor Lang is a professor of economics at Salem State University. She has been teaching a course in Principles of Economics for over 25 years. Professor Lang has never graded on a curve because she believes that relative grading may unduly penalize or benefit a student in an unusually strong or weak class. She always uses an absolute scale for making grades, as shown in the two left columns of Table 4.7.
Grading Scales with Absolute Grading versus Relative Grading
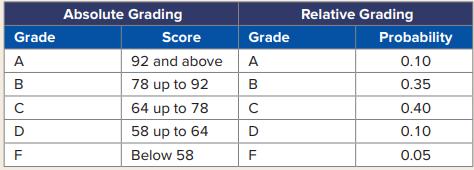
A colleague of Professor Lang’s has convinced her to move to relative grading because it corrects for unanticipated problems. Professor Lang decides to experiment with grading based on the relative scale as shown in the two right columns of Table 4.7. Using this relative grading scheme, the top 10% of students will get A’s, the next 35% B’s, and so on. Based on her years of teaching experience, Professor Lang believes that the scores in her course follow a normal distribution with a mean of 78.6 and a standard deviation of 12.4. Professor Lang wants to use the above information to
1. Calculate probabilities based on the absolute scale. Compare these probabilities to the relative scale.
2. Calculate the range of scores for various grades based on the relative scale. Compare these ranges to the absolute scale.
3. Determine which grading scale makes it harder to get higher grades.
Many teachers would confess that grading is one of the most difficult tasks of their profession. Two common grading systems used in higher education are relative and absolute. Relative grading systems are norm-referenced or curve-based, in which a grade is based on the student’s relative position in class. Absolute grading systems, on the other hand, are criterion referenced, in which a grade is related to the student’s absolute performance in class. In short, with absolute grading, the student’s score is compared to a predetermined scale, whereas with relative grading, the score is compared to the scores of other students in the class
Let X represent a grade in Professor Lang’s class, which is normally distributed with a mean of 78.6 and a standard deviation of 12.4. This information is used to derive the grade probabilities based on the absolute scale. For instance, the probability of receiving an A is derived as P(X ≥ 92) = P(Z ≥ 1.08) = 0.14. Other probabilities, derived similarly, are presented in Table 4.8.
Probabilities Based on Absolute Scale and Relative Scale
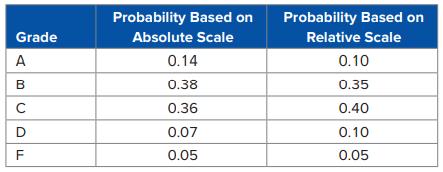
The second column of Table 4.8 shows that 14% of students are expected to receive A’s, 38% B’s, and so on. Although these numbers are generally consistent with the relative scale restated in the third column of Table 4.8, it appears that the relative scale makes it harder for students to get higher grades. For instance, 14% get A’s with the absolute scale compared to only 10% with the relative scale.
Alternatively, we can compare the two grading methods on the basis of the range of scores for various grades. The second column of Table 4.9 restates the range of scores based on absolute grading. In order to obtain the range of scores based on relative grading, it is once again necessary to apply concepts from the normal distribution. For instance, the minimum score required to earn an A with relative grading is derived by solving for x in P(X ≥ x) = 0.10. Because P(X ≥ x) = 0.10 is equivalent to P(Z ≥ z) = 0.10, it follows that z = 1.28. Inserting the proper values of the mean, the standard deviation, and z into x = μ + zσ yields a value of x equal to 94.47. Ranges for other grades, derived similarly, are presented in the third column of Table 4.9
Range of Scores with Absolute Grading versus Relative Grading
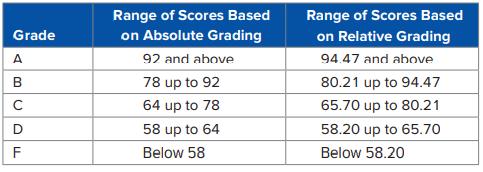
Once again comparing the results in Table 4.9, the use of the relative scale makes it harder for students to get higher grades in Professor Lang’s courses. For instance, in order to receive an A with relative grading, a student must have a score of at least 94.47 versus a score of at least 92 with absolute grading. Both absolute and relative grading methods have their merits and teachers often make the decision on the basis of their teaching philosophy. However, if Professor Lang wants to keep the grades consistent with her earlier absolute scale, she should base her relative scale on the probabilities computed in the second column of Table 4.8.
Step by Step Answer:
Based on the information provided lets address each of the questions posed by Professor Lang Calculate probabilities based on the absolute scale Compa...View the full answer


Business Analytics Communicating With Numbers
ISBN: 9781260785005
1st Edition
Authors: Sanjiv Jaggia, Alison Kelly, Kevin Lertwachara, Leida Chen
