

Samantha Brown is Director of Continuing Education of a major university. The Continuing Education department offers a
Question:
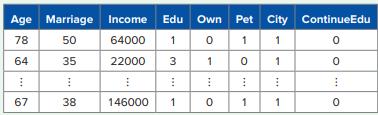
Samantha Brown is Director of Continuing Education of a major university. The Continuing Education department offers a wide range of five-week courses to the community during the summer. Samantha would like to find out which community members are more likely to enroll in these summer courses. She has compiled a data set of 2,000 community members that includes the following variables: age (Age), years of marriage (Marriage), annual income (Income), education level (Edu), whether the person owns his or her residence (Own), whether the person owns a pet (Pet), whether the person lives in the city or suburb (City), and whether the person has enrolled in at least one continuing education course from the university before (ContinueEdu, 1 = enrolled, 0 otherwise). A portion of the Continue_Edu_ Data worksheet is shown in the accompanying table. Build a default classification tree to predict whether a community member is likely to enroll in summer courses. Display the default classification tree.
a. How many leaf nodes are in the tree? What are the predictor variable and the split value for the first split of the default classification tree?
b. Build a full-grown tree. Which cp value is associated with the lowest cross-validation error? How many splits are in the minimum error tree?
c. Is there a simpler tree with a cross-validation error that is within one standard error of the minimum cross validation error? If there is, then which cp value is associated with the best-pruned tree?
d. Prune the full tree to the best-pruned tree or the minimum error tree if the answer to part c is “No.” Display the tree. How many leaf nodes are in the pruned tree?
e. Create a confusion matrix and display the various performance measures. Assign Class 1 to be the positive class. What are the accuracy, sensitivity, specificity, and precision of the pruned tree on the validation data?
f. Change the cutoff value to 0.1. Report the accuracy, sensitivity, specificity, and precision rates of the pruned tree on the validation data.
g. Generate the decile-wise lift chart. What is the lift value of the leftmost bar of the decile-wise lift chart?
h. Generate the ROC curve. What is the area under the ROC curve (or AUC value)?
i. Score the two new individuals in the Continue_Edu_Score worksheet using the pruned tree. What is the probability of the first community member enrolling in summer courses? What is the probability for the second community member? Round your answers to four decimal places.
Step by Step Answer:
a The default classification tree has three leaf nodes The predictor variable and the split value for the first split of the default classification tr...View the full answer


Business Analytics Communicating With Numbers
ISBN: 9781260785005
1st Edition
Authors: Sanjiv Jaggia, Alison Kelly, Kevin Lertwachara, Leida Chen
