

Shown here are the sales data (in $ millions) for furniture and home furnishing stores over a
Question:
Shown here are the sales data (in $ millions) for furniture and home furnishing stores over a recent period of five years. Using this data:a. Construct a time-series graph for one year of the data. Looking at your graph, what are some of your insights and conclusions regarding this industry in that year?b. Construct one graph that displays the data from each of the five years separately but in the same graph so that you can compare the five years. What insights and/or conclusions might you reach about this industry now that you can see the five years in one graph?c. Place the data together in order (perhaps one long column) and construct one graph (similar to part a) with all the data. Seeing one graph with all 60 data points lined up, what insights and understanding can you gain that perhaps you didn’t see in part b?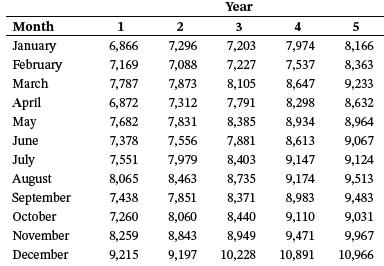
Step by Step Answer:
a This timeseries plot for the year 1 shows up and down swings of sales until October with sales str...View the full answer


Business Statistics For Contemporary Decision Making
ISBN: 9781119577621
3rd Canadian Edition
Authors: Ken Black, Ignacio Castillo
