

The following data represent the afternoon high temperatures for 50 construction days during a year in Toronto.
Question:
The following data represent the afternoon high temperatures for 50 construction days during a year in Toronto.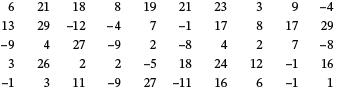
a. Construct a frequency distribution for the data using five class intervals.b. Construct a frequency distribution for the data using 10 class intervals.c. Examine the results of (a) and (b) and comment on the usefulness of the frequency distribution in terms of temperature summarization capability.
Fantastic news! We've Found the answer you've been seeking!
Step by Step Answer:
a Range maxmin 2912 41 Class width 415 82 9 b Class width 4110 41 ...View the full answer

Answered By
OTIENO OBADO
I have a vast experience in teaching, mentoring and tutoring. I handle student concerns diligently and my academic background is undeniably aesthetic
3+ Reviews
10+ Question Solved
Related Book For 
Business Statistics For Contemporary Decision Making
ISBN: 9781119577621
3rd Canadian Edition
Authors: Ken Black, Ignacio Castillo
Question Posted:
