

The following table contains the annual data for carbon dioxide (CO2) emissions in Canada over a 34-year
Question:
The following table contains the annual data for carbon dioxide (CO2) emissions in Canada over a 34-year period as published by the OECD.
a. Use a 3-year moving average to forecast the CO2 emissions for the years 1980 through 2010 for these data. Compute the error of each forecast and then determine the mean absolute deviation of error for the forecast.b. Use exponential smoothing and α = 0.2 to forecast the data from 1979 through 2010. Let the forecast for 1978 equal the actual value for 1977. Compute the error of each forecast and then determine the mean absolute deviation of error for the forecast.c. Compare the results obtained in parts (a) and (b) using MAD. Which technique seems to perform better? Why?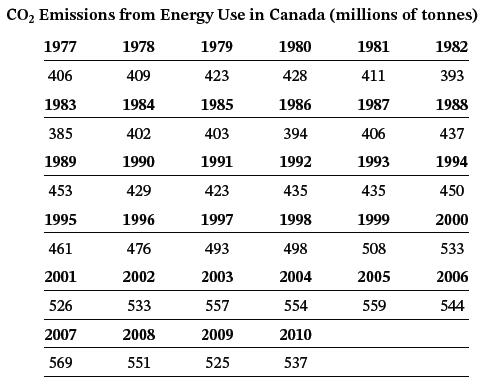
Step by Step Answer:
a b c The threeyear moving average produced a smaller MAD 171 than did exponential smoothing with a ...View the full answer


Business Statistics For Contemporary Decision Making
ISBN: 9781119577621
3rd Canadian Edition
Authors: Ken Black, Ignacio Castillo
