

The table below shows the quarterly exports (in $ millions) from eight fictional towns in North America
Question:
The table below shows the quarterly exports (in $ millions) from eight fictional towns in North America over a two-year period.
a. Construct a time-series graph for one of the cities. Looking at your graph, what are some of your insights and conclusions regarding this city’s exports over the two years?
b. Construct one graph that displays the eight quarters of data for each city separately but in the same graph so that you can compare the eight cities. What insights and/or conclusions about the exports of these cities do you have now that you can see all five in one graph?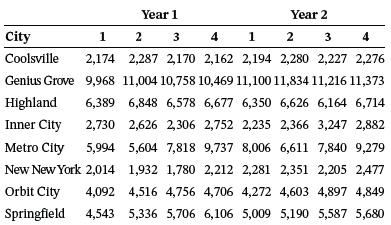
Fantastic news! We've Found the answer you've been seeking!
Step by Step Answer:
a Examining the exports for Coolsville over these two years there was an incr...View the full answer

Answered By
Jehal Shah
I believe everyone should try to be strong at logic and have good reading habit. Because If you possess these two skills, no matter what difficult situation is, you will definitely find a perfect solution out of it. While logical ability gives you to understand complex problems and concepts quite easily, reading habit gives you an open mind and holistic approach to see much bigger picture.
So guys, I always try to explain any concept keeping these two points in my mind. So that you will never forget any more importantly get bored.
Last but not the least, I am finance enthusiast. Big fan of Warren buffet for long term focus investing approach. On the same side derivatives is the segment I possess expertise.
If you have any finacne related doubt, do reach me out.
1+ Reviews
10+ Question Solved
Related Book For 
Business Statistics For Contemporary Decision Making
ISBN: 9781119577621
3rd Canadian Edition
Authors: Ken Black, Ignacio Castillo
Question Posted:
