

This exercise is most easily completed with access to a computer and software; alternatively, you can use
Question:
This exercise is most easily completed with access to a computer and software; alternatively, you can use the formulas and do the computations with a calculator.
Mario insists that tall men receive higher wages than short men. To test his hypothesis, he collects height and hourly wage data from a random sample of ten men. Here are the data.
(Keep in mind they are entirely fictitious!)
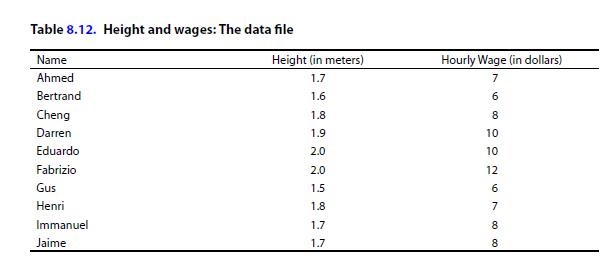
a) Compute the mean and the standard deviation for each variable. Since this is a sample, divide by n – 1 when you calculate the variance.
b) Compute each man’s height Z-score and wage Z-score. (You can round off to one decimal place.)
c) Use graph paper to plot the data in a scatter plot. Put height on the X-axis and wages on the Y-axis. (Why?)
d) Compute the correlation coefficient using the average product-moment formula. Write a sentence or two of interpretation.
e) Compute R-squared, and write a sentence of interpretation.
f) Find the slope for the OLS regression line, and use the information provided to find the Y-intercept.
g) Write the regression equation. If Gus grew a centimeter, how much more would we expect him to earn per hour?
h) Do you agree with Mario? Why or why not?
(If you have access to a computer and statistical software, you can do this problem on the computer.)
Step by Step Answer:
Answers may be found by consulting the included tables and graph which were generated by a computer program a Height Mean 177 meters S 1634 meters Var...View the full answer


The Joy Of Stats A Short Guide To Introductory Statistics In The Social Sciences
ISBN: 9781487527297
3rd Edition
Authors: Roberta Garner, Michael Ash
