

Figure 9.6 illustrates the Excel calculation procedure to calculate the required indices for the average annual oil
Question:
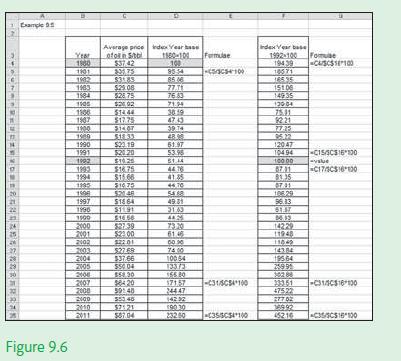
Figure 9.6 illustrates the Excel calculation procedure to calculate the required indices for the average annual oil price.
Fantastic news! We've Found the answer you've been seeking!
Step by Step Answer:
Interpretation 1 For the first index series the price of oil in the year 20...View the full answer

Answered By
Michael Owens
I am a competent Software Engineer with sufficient experience in web applications development using the following programming languages:-
HTML5, CSS3, PHP, JAVASCRIPT, TYPESCRIPT AND SQL.
1+ Reviews
10+ Question Solved
Related Book For 

Question Posted:
