

Figure 9.7 illustrates the calculation procedure to calculate the average oil price and index values for oil
Question:
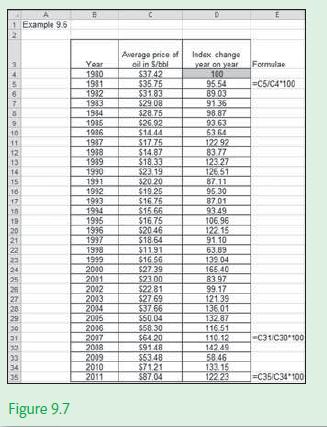
Figure 9.7 illustrates the calculation procedure to calculate the average oil price and index values for oil prices.
Fantastic news! We've Found the answer you've been seeking!
Step by Step Answer:
Interpretation The average oil price in 1985 for example has dropped w...View the full answer

Answered By
PALASH JHANWAR
I am a Chartered Accountant with AIR 45 in CA - IPCC. I am a Merit Holder ( B.Com ). The following is my educational details.
PLEASE ACCESS MY RESUME FROM THE FOLLOWING LINK: https://drive.google.com/file/d/1hYR1uch-ff6MRC_cDB07K6VqY9kQ3SFL/view?usp=sharing
3+ Reviews
10+ Question Solved
Related Book For 

Question Posted:
