

Obtain a scatter plot for the data in Table 1.37 that represents the passenger miles flown by
Question:
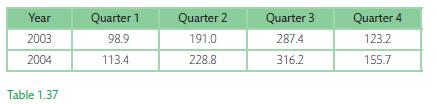
Obtain a scatter plot for the data in Table 1.37 that represents the passenger miles flown by a UK-based airline (millions of passenger miles) during the period 2003–2004.
Comment on the relationship between miles flown and quarter.
Step by Step Answer:

This question has not been answered yet.
You can Ask your question!
Related Book For 

Question Posted:
