

Table 1.14 represents the number of customers visited by a salesman over an 80-week period Use Excel
Question:
Table 1.14 represents the number of customers visited by a salesman over an 80-week period
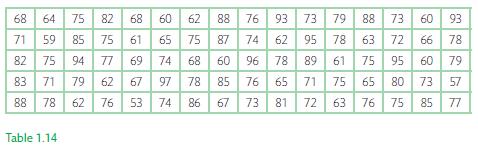
Use Excel to construct a grouped frequency distribution from the data set in Table 1.14 and indicate both stated and mathematical limits (start at 50–54 with class width of 5).
Fantastic news! We've Found the answer you've been seeking!
Step by Step Answer:
To construct a grouped frequency distribution in Excel you can follow these steps Ill show you how t...View the full answer

Answered By
Utsab mitra
I have the expertise to deliver these subjects to college and higher-level students. The services would involve only solving assignments, homework help, and others.
I have experience in delivering these subjects for the last 6 years on a freelancing basis in different companies around the globe. I am CMA certified and CGMA UK. I have professional experience of 18 years in the industry involved in the manufacturing company and IT implementation experience of over 12 years.
I have delivered this help to students effortlessly, which is essential to give the students a good grade in their studies.
2+ Reviews
10+ Question Solved
Related Book For 

Question Posted:
