

Draw a suitable bar chart for the data in Table 1.16. Industrial sources for consumption and investment
Question:
Draw a suitable bar chart for the data in Table 1.16.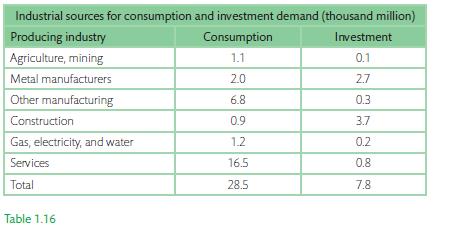
Step by Step Answer:

This question has not been answered yet.
You can Ask your question!
Related Book For 

Question Posted:
