

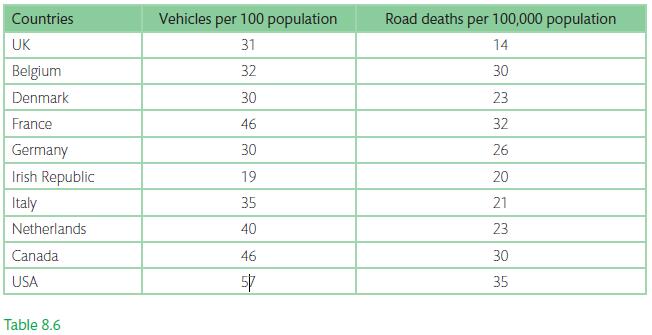
Table 8.6 indicates the number of vehicles and number of road deaths in ten countries. (a) Construct
Question:
Table 8.6 indicates the number of vehicles and number of road deaths in ten countries.
(a) Construct a scatter plot and comment upon the possible relationship between the two variables.
(b) Calculate the product moment correlation coefficient between vehicle numbers and road deaths.
(c) Use your answers to (a) and (b) to comment upon your results.
Step by Step Answer:

This question has not been answered yet.
You can Ask your question!
Related Book For 

Question Posted:
