

Barker and McGhie (1984) collected 100 slugs from the species Limax maximus around Hamilton, New Zealand. They
Question:
Barker and McGhie (1984) collected 100 slugs from the species Limax maximus around Hamilton, New Zealand. They were preserved in a relaxed state, and their length in millimeters \((\mathrm{mm})\) and weight in grams (g) were recorded. Thirty of the observations are shown below.
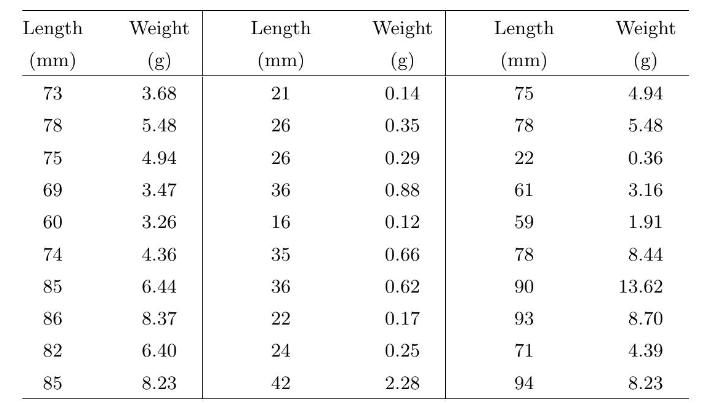
[Minitab:] The full data are in the Minitab worksheet slug.mtw.
\([\mathbf{R}:]\) The full can be accessed in \(\mathrm{R}\) by typing data(slug)
(a) [Minitab:] Plot weight on length using Minitab.
[R:] Plot weight on length using \(R\) :
plot (weight \(\sim\) length, data \(=\) slug)
What do you notice about the shape of the relationship?
(b) Often when we have a nonlinear relationship, we can transform the variables by taking logarithms and achieve linearity. In this case, weight is related to volume which is related to length times width times height. Taking logarithms of weight and length should give a more linear relationship.
[Minitab:] Plot \(\log (\) weight) on \(\log\) (length) using Minitab.
[R:] Plot \(\log (\) weight) on \(\log\) (length) using \(\mathrm{R}\).
plot (log.wt \({ }^{\sim} \log \cdot\) len, data \(=\) slug \()\)
Does this relationship appear to be linear?
(c) From the scatterplot of \(\log\) (weight) on \(\log\) (length) can you identify any points that do not appear to \(t\) the pattern?
Step by Step Answer:

This question has not been answered yet.
You can Ask your question!

Introduction To Bayesian Statistics
ISBN: 9781118091562
3rd Edition
Authors: William M. Bolstad, James M. Curran
