

Carbon Dioxide Levels Over Time Scientists are concerned about global warming and the effect of carbon dioxide
Question:
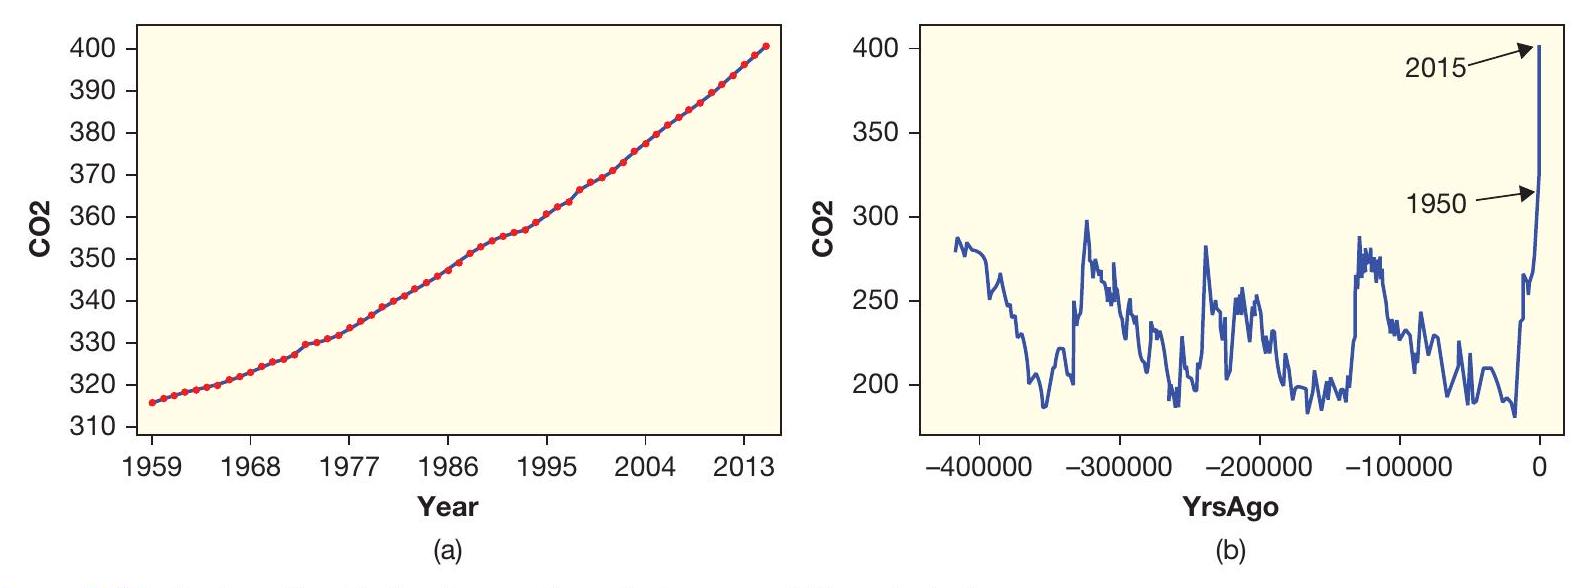
Carbon Dioxide Levels Over Time Scientists are concerned about global warming and the effect of carbon dioxide emissions on the atmosphere. Figure 2.89 shows the concentration of carbon dioxide $(\mathrm{CO} 2)$ in the atmosphere, in parts per million (ppm), over two different time intervals. Often, plots of data over time can look very different depending on the time interval selected for the graph. Figure 2.89 (a) shows the concentration of CO2 during the period from 1959 to 2015, while Figure 2.89 (b) shows the concentration over a very different window: the last 400,000 years!!
(a) Using Figure 2.89(a), estimate the $\mathrm{CO} 2$ concentration in 1960. Estimate the CO2 concentration in 2015.
(b) Is $\mathrm{CO} 2$ concentration primarily increasing, decreasing, or oscillating up and down during the period from 1959 to 2015 ?
(c) In the period of time shown in Figure 2.89(b), is $\mathrm{CO} 2$ concentration primarily increasing, decreasing, or oscillating up and down?
(d) In Figure 2.89(b), locate the portion of data that is shown in Figure 2.89(a). What does the curve look like on that piece?
(e) What was the highest concentration of $\mathrm{CO} 2$ ever in the 400,000 year history of the Earth, before 1950 ?
(f) For more data visualization on this subject, watch the 3-minute animated video "CO2 Movie" at http://www.esrl.noaa.gov/gmd/ccgg/ trends/history.html.[^32]
(b)
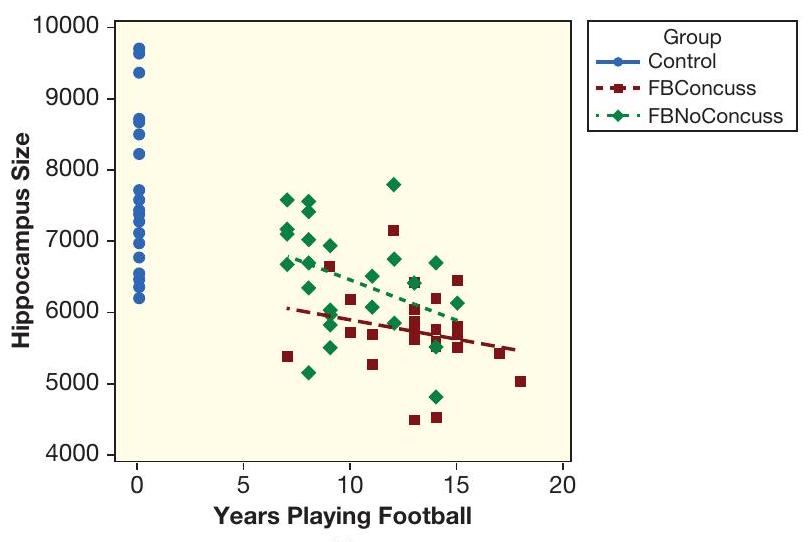
Figure 2.88 Brain size, football experience, and concussions
(a)
(b)
Figure 2.89 Carbon dioxide levels over time, in two very different windows
Step by Step Answer:

This question has not been answered yet.
You can Ask your question!


Statistics, Enhanced Unlocking The Power Of Data
ISBN: 9781119308843
2nd Edition
Authors: Robin H Lock, Patti Frazer Lock, Kari Lock Morgan, Eric F Lock, Dennis F Lock
