

The following table shows attendance data collected by the Motion Picture Association of America during the period
Question:
The following table shows attendance data collected by the Motion Picture Association of America during the period 2014 to 2016. Figures are the number (in millions) of frequent moviegoers in each age group.
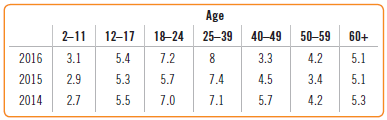
a) What percent of all frequent moviegoers over the three year period were people between the ages of 12 and 24?
b) What percent of the frequent moviegoers in 2016 were people between the ages of 12 and 39?
c) What percent of all frequent moviegoers during this period were people between the ages of 18 and 24 who went to the movies in 2014?
d) What percent of frequent moviegoers in 2015 were people 60 years old and older?
e) What percent of all frequent moviegoers in the three year period were people 60 years old and older who went to the movies in 2015?
f) Compare the conditional distributions of the age groups across years. Write a couple of sentences summarizing what you see.
Step by Step Answer:
a 334 1621991081 b 567 54728363 c 65 71081 d 149 51343 e ...View the full answer


Business Statistics
ISBN: 9780134705217
4th Edition
Authors: Norean Sharpe, Richard Veaux, Paul Velleman
