

The following table shows the number of films in each MPAA (www.mpaa.org) rating by year for each
Question:
The following table shows the number of films in each MPAA (www.mpaa.org) rating by year for each of the years between 2006 and 2015. (Data extracted from Movies 06-15)
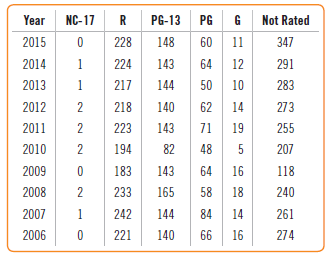
a) What percent of all these films are G rated?
b) What percent of all films in 2008 were G rated?
c) What percent of all films were PG-13 and came out in 2012?
d) What percent of all films produced in 2009 or later were PG-13?
e) What percent of all films produced from 2006 to 2009 were rated PG-13, R or NC-17?
f) Compare the conditional distributions of the ratings for films produced in 2011 or later to those produced from 2006 to 2010. Write a couple of sentences summarizing what you see.
Step by Step Answer:
a 20 1356897 b 25 18716 c 20 1406897 d 200 9434718 ...View the full answer


Business Statistics
ISBN: 9780134705217
4th Edition
Authors: Norean Sharpe, Richard Veaux, Paul Velleman
