

The following table shows the number of people, in thousands, in the United States with and without
Question:
The following table shows the number of people, in thousands, in the United States with and without health insurance in 2016, according to the U.S. Census Bureau:
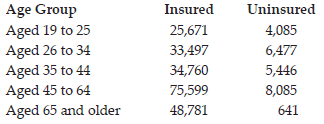
a. What percentage of the U.S. population in 2016 did not have health insurance and was between the ages of 19 to 25 years?
b. What percentage of the U.S. population in 2016 did not have health insurance or was between the ages of 26 to 35 years?
c. What percentage of the U.S. population in 2016 did have health insurance, given they were 65 years or older?
d. Do age group and health insurance appear to be independent or dependent events? Define Event A as a person 45 to 64 years old and Event B as the person insured. What conclusions can be drawn with this information?
Fantastic news! We've Found the answer you've been seeking!
Step by Step Answer:
a b c d Using these even...View the full answer

Answered By
Somshukla Chakraborty
I have a teaching experience of more than 4 years by now in diverse subjects like History,Geography,Political Science,Sociology,Business Enterprise,Economics,Environmental Management etc.I teach students from classes 9-12 and undergraduate students.I boards I handle are IB,IGCSE, state boards,ICSE, CBSE.I am passionate about teaching.Full satisfaction of the students is my main goal.
I have completed my graduation and master's in history from Jadavpur University Kolkata,India in 2012 and I have completed my B.Ed from the same University in 2013. I have taught in a reputed school of Kolkata (subjects-History,Geography,Civics,Political Science) from 2014-2016.I worked as a guest lecturer of history in a college of Kolkata for 2 years teaching students of 1st ,2nd and 3rd year. I taught Ancient and Modern Indian history there.I have taught in another school in Mohali,Punjab teaching students from classes 9-12.Presently I am working as an online tutor with concept tutors,Bangalore,India(Carve Niche Pvt.Ltd.) for the last 1year and also have been appointed as an online history tutor by Course Hero(California,U.S) and Vidyalai.com(Chennai,India).
2+ Reviews
10+ Question Solved
Related Book For 
Question Posted:
