

The following time series graph shows daily closing stock prices for Toyota Motor Manufacturing from April 1,
Question:
The following time series graph shows daily closing stock prices for Toyota Motor Manufacturing from April 1, 2008, through June 21, 2013.
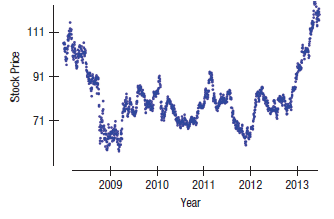
a) Which time series components seem to be present? The method of moving averages was applied to these data. Here are time series graphs showing moving average results using two different lengths:
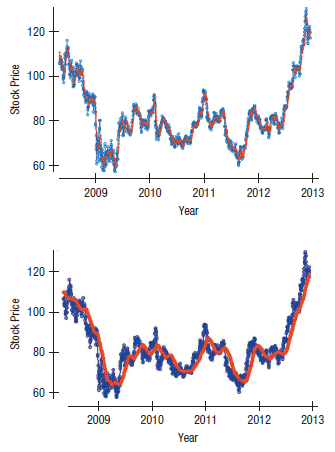
b) In which application is a larger length used?
Fantastic news! We've Found the answer you've been seeking!
Step by Step Answer:
a Irregular no regular repea...View the full answer

Answered By
Navashree Ghosh
I believe in quality work and customer satisfaction. So, I can assure you that you will get quality work from me when you hire me. Let's work together and build a long-term association.
82+ Reviews
116+ Question Solved
Related Book For 

Business Statistics
ISBN: 9780133899122
3rd Canadian Edition
Authors: Norean D. Sharpe, Richard D. De Veaux, Paul F. Velleman, David Wright
Question Posted:
