

The following time series graph shows daily closing stock prices (adjusted for splits and dividends) for Google
Question:
The following time series graph shows daily closing stock prices (adjusted for splits and dividends) for Google Inc. from January 1, 2008, through June 21, 2013.
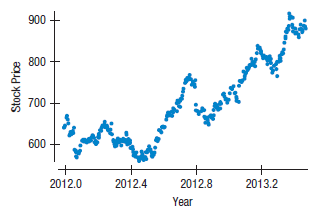
a) Which time series components are evident? Single exponential smoothing (SES) models were found for these data. Examine the following time series graphs showing two different smoothing coefficients values (α = 0.2 and α = 0.8).
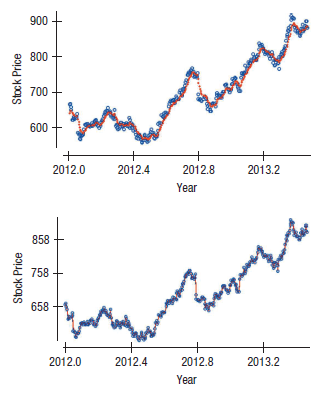
b) In which graph is a larger value of a used?
Fantastic news! We've Found the answer you've been seeking!
Step by Step Answer:
a Trend and irregular no ...View the full answer

Answered By
Vijesh J
My passion to become a tutor is a lifetime milestone. Being a finance and marketing professional with hands-on experience in wealth management, portfolio management, team handling and actively contributing in promoting the company. Highly talented in managing and educating students in most attractive ways were students get involved. I will always give perfection to my works. Time is the most important for the works and I provide every answer on time without a delay. I will proofread each and every work and will deliver a with more perfection.
5+ Reviews
15+ Question Solved
Related Book For 

Business Statistics
ISBN: 9780133899122
3rd Canadian Edition
Authors: Norean D. Sharpe, Richard D. De Veaux, Paul F. Velleman, David Wright
Question Posted:
