

The table shown below comes from a study reported by Larry Bartels (2004), a political scientist. The
Question:
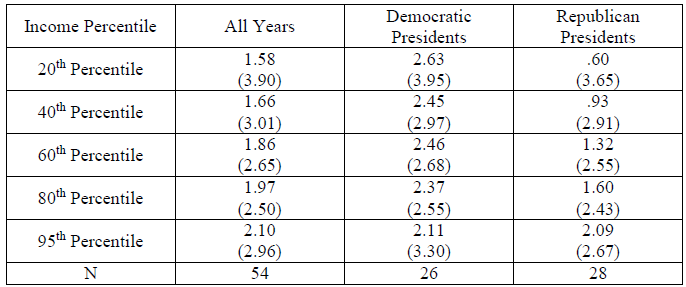
1. What do the means in the All Years column tell you about annual real income growth as related to income percentile?
2. What do the standard deviations in the All Years column tell you about fluctuations in annual income growth as related to income percentile?
3. What do the means in the Democratic President column and Republican Presidents column tell you about annual real income growth as related to income percentile and whether the president was a Democratic or a Republican?
4. Was the annual income growth rate more variable when a Democrat or when a Republican occupied the White House?
Fantastic news! We've Found the answer you've been seeking!
Step by Step Answer:
1 Annual income growth increased fairly smoothly from the 20th percentile to the 95th percen...View the full answer

Answered By
Anum Naz
Lecturer and researcher with 10+ years of experience teaching courses in both undergraduate and postgraduate levels. Supervised 17 BA theses, 07 MA theses, and 1 Ph.D. dissertations. Edited and co-authored 2 monographs on contemporary trends in political thought. Published over articles in peer-reviewed journals.
11+ Reviews
51+ Question Solved
Related Book For 

Question Posted:
