

The figures in the table come from the Monthly Sales for Retail Trade and Food Services report
Question:
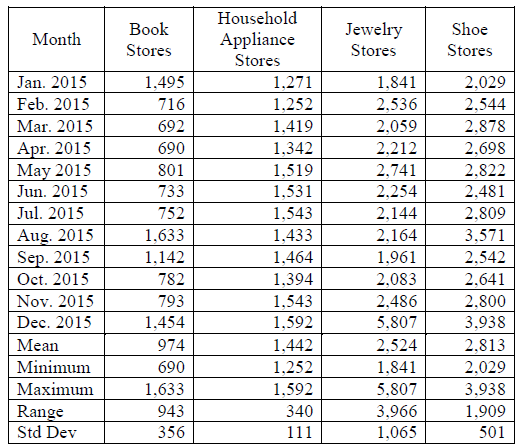
1. On average, which type of store has the highest monthly sales and which has the lowest?
2. Which type of store has the greatest variability in sales and which has the least? What is a likely explanation for the difference in variability?
Fantastic news! We've Found the answer you've been seeking!
Step by Step Answer:
1 Shoe stores have the highest mean monthly sales 2813000000 and book stores have the lo...View the full answer

Answered By
Issa Shikuku
I have vast experience of four years in academic and content writing with quality understanding of APA, MLA, Harvard and Chicago formats. I am a dedicated tutor willing to hep prepare outlines, drafts or find sources in every way possible. I strive to make sure my clients follow assignment instructions and meet the rubric criteria by undertaking extensive research to develop perfect drafts and outlines. I do this by ensuring that i am always punctual and deliver quality work.
6+ Reviews
13+ Question Solved
Related Book For 

Question Posted:
