

The graph shows the probability density function for a car brand that has a mean fuel efficiency
Question:
The graph shows the probability density function for a car brand that has a mean fuel efficiency of 26 miles per gallon and a standard deviation of 2.4 miles per gallon.
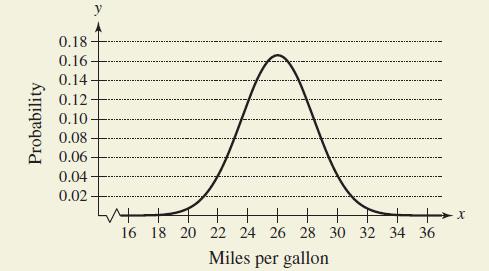
(a) Which is greater, the probability of choosing a car at random that gets between 26 and 28 miles per gallon or the probability of choosing a car at random that gets between 22 and 24 miles per gallon?
(b) Which is greater, the probability of choosing a car at random that gets between 20 and 22 miles per gallon or the probability of choosing a car at random that gets at least 30 miles per gallon?
Fantastic news! We've Found the answer you've been seeking!
Step by Step Answer:
a The area under the curve is greater on the interval 26 x 28 than on th...View the full answer

Answered By
Utsab mitra
I have the expertise to deliver these subjects to college and higher-level students. The services would involve only solving assignments, homework help, and others.
I have experience in delivering these subjects for the last 6 years on a freelancing basis in different companies around the globe. I am CMA certified and CGMA UK. I have professional experience of 18 years in the industry involved in the manufacturing company and IT implementation experience of over 12 years.
I have delivered this help to students effortlessly, which is essential to give the students a good grade in their studies.
2+ Reviews
10+ Question Solved
Related Book For 

Question Posted:
