

The table shows the net sales x (in billions of dollars), the total assets y (in billions
Question:
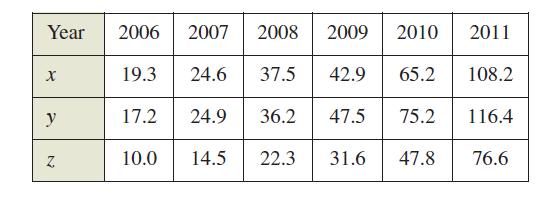
The table shows the net sales x (in billions of dollars), the total assets y (in billions of dollars), and the shareholder's equity z (in billions of dollars) for Apple for the years 2006 through 2011.
A model for these data is
![]()
(a) Use a graphing utility and the model to approximate z for the given values of x and y.
(b) Which of the two variables in this model has the greater influence on shareholder's equity? Explain.
(c) Simplify the expression for ƒ(x, 150) and interpret its
meaning in the context of the problem.
Fantastic news! We've Found the answer you've been seeking!
Step by Step Answer:
a b y has the greater influence because its c...View the full answer

Answered By
S Mwaura
A quality-driven writer with special technical skills and vast experience in various disciplines. A plagiarism-free paper and impeccable quality content are what I deliver. Timely delivery and originality are guaranteed. Kindly allow me to do any work for you and I guarantee you an A-worthy paper.
27+ Reviews
73+ Question Solved
Related Book For 

Question Posted:
