Let A represent the area under the graph of y = x 3 between x = 0
Question:
Let A represent the area under the graph of y = x3 between x = 0 amd x = 1. In this problem, we will follow the process in Exercise 30 to approximate A. (a) As in (a)–(d) in Exercise 30, separately divide [0, 1] into 2, 3, 5, and 10 equal-width subintervals, and in each case compute an overestimate of A using rectangles on each subinterval whose height is the value of x3 at the right end of the subinterval.
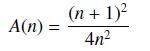
In this case, it can be shown that if we use n equal-width subintervals, then the total area A(n) of the n rectangles is
(b) Compute A(n) for n = 2, 3, 5, 10 to verify your results from (a). (c) Compute A(n) for n = 100, 1000, and 10,000. Use your results to conjecture what the area A equals.
Data From Exercise 30
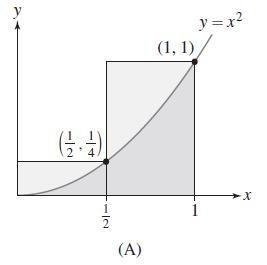
Figure 6(A) shows two rectangles whose combined area is an overestimate of the area A under the graph of y = x2 from x = 0 to x = 1. Compute the combined area of the rectangles.
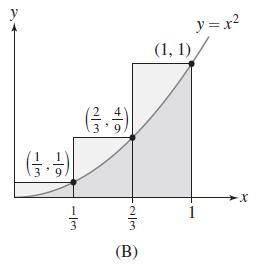
We can improve the estimate by using three rectangles obtained by dividing [0, 1] into thirds, as shown in Figure 6(B). Compute the combined areas of the three rectangles.
Transcribed Image Text:
A(n) =
(n + 1)²
4n²
Fantastic news! We've Found the answer you've been seeking!
Step by Step Answer:
Answer rating: 66% (3 reviews)
a Dividing 0 1 into 2 equalwidth subintervals produces two rectangles with width 12 and he...View the full answer
Answered By
Ashington Waweru
I am a lecturer, research writer and also a qualified financial analyst and accountant. I am qualified and articulate in many disciplines including English, Accounting, Finance, Quantitative spreadsheet analysis, Economics, and Statistics. I am an expert with sixteen years of experience in online industry-related work. I have a master's in business administration and a bachelor’s degree in education, accounting, and economics options.
I am a writer and proofreading expert with sixteen years of experience in online writing, proofreading, and text editing. I have vast knowledge and experience in writing techniques and styles such as APA, ASA, MLA, Chicago, Turabian, IEEE, and many others.
I am also an online blogger and research writer with sixteen years of writing and proofreading articles and reports. I have written many scripts and articles for blogs, and I also specialize in search engine
I have sixteen years of experience in Excel data entry, Excel data analysis, R-studio quantitative analysis, SPSS quantitative analysis, research writing, and proofreading articles and reports. I will deliver the highest quality online and offline Excel, R, SPSS, and other spreadsheet solutions within your operational deadlines. I have also compiled many original Excel quantitative and text spreadsheets which solve client’s problems in my research writing career.
I have extensive enterprise resource planning accounting, financial modeling, financial reporting, and company analysis: customer relationship management, enterprise resource planning, financial accounting projects, and corporate finance.
I am articulate in psychology, engineering, nursing, counseling, project management, accounting, finance, quantitative spreadsheet analysis, statistical and economic analysis, among many other industry fields and academic disciplines. I work to solve problems and provide accurate and credible solutions and research reports in all industries in the global economy.
I have taught and conducted masters and Ph.D. thesis research for specialists in Quantitative finance, Financial Accounting, Actuarial science, Macroeconomics, Microeconomics, Risk Management, Managerial Economics, Engineering Economics, Financial economics, Taxation and many other disciplines including water engineering, psychology, e-commerce, mechanical engineering, leadership and many others.
I have developed many courses on online websites like Teachable and Thinkific. I also developed an accounting reporting automation software project for Utafiti sacco located at ILRI Uthiru Kenya when I was working there in year 2001.
I am a mature, self-motivated worker who delivers high-quality, on-time reports which solve client’s problems accurately.
I have written many academic and professional industry research papers and tutored many clients from college to university undergraduate, master's and Ph.D. students, and corporate professionals. I anticipate your hiring me.
I know I will deliver the highest quality work you will find anywhere to award me your project work. Please note that I am looking for a long-term work relationship with you. I look forward to you delivering the best service to you.


 We can improve the estimate by using three rectangles obtained by dividing [0, 1] into thirds, as shown in Figure 6(B). Compute the combined areas of the three rectangles.