

On the contour map in Figure 11: (a) Identify the points where = g for some
Question:
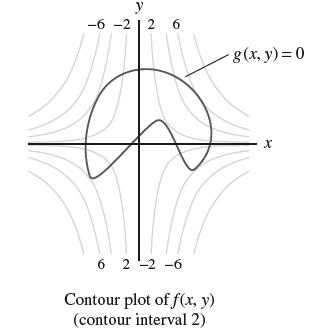
On the contour map in Figure 11:
(a) Identify the points where ∇ƒ = λ∇g for some scalar λ.
(b) Identify the minimum and maximum values of ƒ(x, y) subject to g(x, y) = 0.
Fantastic news! We've Found the answer you've been seeking!
Step by Step Answer:
a The gradient Vg is orthogonal to the constraint curve ...View the full answer

Answered By
YOGENDRA NAILWAL
As I'm a Ph.D. student, so I'm more focussed on my chemistry laboratory. I have qualified two national level exams viz, GATE, and NET JRF (Rank 68). So I'm highly qualified in chemistry subject. Also, I have two years of teaching experience in this subject, which includes college teacher as well as a personal tutor. I can assure you if you hire me on this particular subject, you are never going to regret it.
Best Regards.
1+ Reviews
10+ Question Solved
Related Book For 

Question Posted:
