

Figure 9 shows graphs of the number of hours of daylight as functions of the time of
Question:
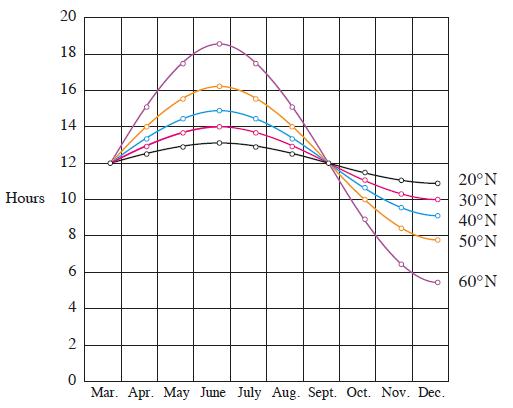
Figure 9 shows graphs of the number of hours of daylight as functions of the time of the year at several latitudes. Given that Philadelphia is located at approximately 40°N latitude, find a function that models the length of daylight at Philadelphia.
Figure 9
Fantastic news! We've Found the answer you've been seeking!
Step by Step Answer:
Notice that each curve resembles a shifted and stretched sine function By looking at the ...View the full answer

Answered By
Nazrin Ziad
I am a post graduate in Zoology with specialization in Entomology.I also have a Bachelor degree in Education.I posess more than 10 years of teaching as well as tutoring experience.I have done a project on histopathological analysis on alcohol treated liver of Albino Mice.
I can deal with every field under Biology from basic to advanced level.I can also guide you for your project works related to biological subjects other than tutoring.You can also seek my help for cracking competitive exams with biology as one of the subjects.
2+ Reviews
10+ Question Solved
Related Book For 
Question Posted:
