

Use a graphing utility to graph the hyperbolas for e = 1.1, 1.3, 1.5, 1.7, and 2
Question:
Use a graphing utility to graph the hyperbolas 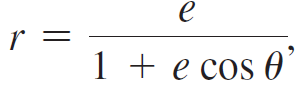 for e = 1.1, 1.3, 1.5, 1.7, and 2 on the same set of axes. Explain how the shapes of the curves vary as e changes.
Fantastic news! We've Found the answer you've been seeking!
Step by Step Answer:
As e gets la...View the full answer

Answered By
Muhammad Umair
I have done job as Embedded System Engineer for just four months but after it i have decided to open my own lab and to work on projects that i can launch my own product in market. I work on different softwares like Proteus, Mikroc to program Embedded Systems. My basic work is on Embedded Systems. I have skills in Autocad, Proteus, C++, C programming and i love to share these skills to other to enhance my knowledge too.
1+ Reviews
10+ Question Solved
Related Book For 

Calculus Early Transcendentals
ISBN: 978-0321947345
2nd edition
Authors: William L. Briggs, Lyle Cochran, Bernard Gillett
Question Posted:
