

A population model developed by the U.S. Census Bureau uses the formula to estimate the population of
Question:
A population model developed by the U.S. Census Bureau uses the formula
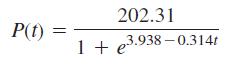
to estimate the population of the United States (in millions) for every 10th year from the base year 1790. Thus, for instance, t = 0 corresponds to 1790, t = 1 to 1800, t = 10 to 1890, and so on. The model excludes Alaska and Hawaii.
a. Use this formula to compute the population of the contiguous United States for the years 1790, 1800, 1830, 1860, 1880, 1900, 1920, 1940, 1960, 1980, 1990, and 2000.
b. Sketch the graph of P(t). When does this model predict that the population of the contiguous United States will be increasing most rapidly?
Fantastic news! We've Found the answer you've been seeking!
Step by Step Answer:
a To use this formula to compute the population of US for the years 1790 180...View the full answer

Answered By
PALASH JHANWAR
I am a Chartered Accountant with AIR 45 in CA - IPCC. I am a Merit Holder ( B.Com ). The following is my educational details.
PLEASE ACCESS MY RESUME FROM THE FOLLOWING LINK: https://drive.google.com/file/d/1hYR1uch-ff6MRC_cDB07K6VqY9kQ3SFL/view?usp=sharing
3+ Reviews
10+ Question Solved
Related Book For 

Calculus For Business, Economics And The Social And Life Sciences
ISBN: 9780073532387
11th Brief Edition
Authors: Laurence Hoffmann, Gerald Bradley, David Sobecki, Michael Price
Question Posted:
