

An analysis similar to that of the previous exercise can be done for the 100-meter sprint, for
Question:
An analysis similar to that of the previous exercise can be done for the 100-meter sprint, for which the winning times in the Summer Olympic Games since 1928 are listed in the table below. Let x be the number of years since 1900.
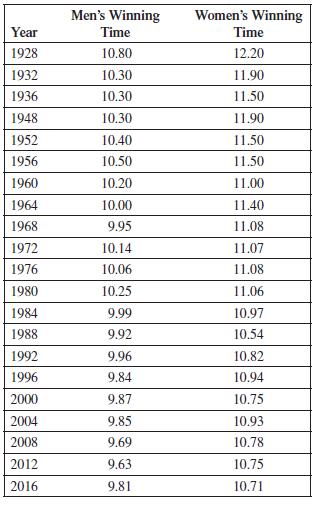
(a) Find the least squares line for the men’s winning time.
(b) Find the least squares line for the women’s winning time.
(c) Suppose the men’s and women’s winning times continue to improve as predicted by the equations found in parts (a) and (b). In what year will the women’s winning time beat the men’s winning time? (Remember that the Summer Olympic Games occur only every four years.)
(d) Calculate the correlation coefficient for both the men’s and the women’s winning time. What do these numbers tell you?
(e) Draw a plot of the data on the window 0 ≤ x ≤ 120, 9 ≤ Y ≤ 12.5, including the least squares lines, and discuss to what extent a linear function describes the trend in the data.
Step by Step Answer:
a Use a calculators statistical features to obt...View the full answer


