

Consider the following table of data. (a) Calculate the least squares line and the correlation coefficient. (b)
Question:
Consider the following table of data.
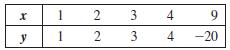
(a) Calculate the least squares line and the correlation coefficient.
(b) Repeat part (a), but this time delete the last point.
(c) Draw a graph of the data, and use it to explain the dramatic difference between the answers to parts (a) and (b).
Fantastic news! We've Found the answer you've been seeking!
Step by Step Answer:
a b c The point 9 20 is an outlier that ...View the full answer

Answered By
Omar ELmoursi
I'm Omar, I have Bachelor degree in Business and Finance, My unique approach is to help students with questions and assignments, I can teach Business, Math, Accounting, Managerial Accounting, Economy, Human resources management, organizational behavior, project management, I have experience dealing with different types of students and teach them how to deal with different types of exercises.
4+ Reviews
10+ Question Solved
Related Book For 

Question Posted:
