

Consider the following table of data. (a) Calculate the least squares line and the correlation coefficient. (b)
Question:
Consider the following table of data.
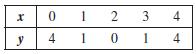
(a) Calculate the least squares line and the correlation coefficient.
(b) Sketch a graph of the data.
(c) Comparing your answers to parts (a) and (b), does a correlation coefficient of 0 mean that there is no relationship between the x- and y- values? Would some curve other than a line fit the data better? Explain.
Fantastic news! We've Found the answer you've been seeking!
Step by Step Answer:
a b c No a correlation coefficient of 0 means that ...View the full answer

Answered By
Mishark muli
Having any assignments and any other research related work? worry less for I am ready to help you with any task. I am quality oriented and dedicated always to produce good and presentable work for the client once he/she entrusts me with their work. i guarantee also non plagiarized work and well researched work to give you straight As in all your units.Feel free to consult me for any help and you will never regret
11+ Reviews
37+ Question Solved
Related Book For 

Question Posted:
