

For many years researchers thought that the basal metabolic rate (BMR) in mammals was a power function
Question:
For many years researchers thought that the basal metabolic rate (BMR) in mammals was a power function of the mass, with disagreement on whether the power was 0.67 or 0.75. More recently, White et al. proposed that the power may vary for mammals with different evolutionary lineages. The following table shows a portion of their data containing the natural logarithm of the mass (in grams) and the natural logarithm of the BMR (in mL of oxygen per hour) for 12 species from the genus Peromyscus, or deer mouse.
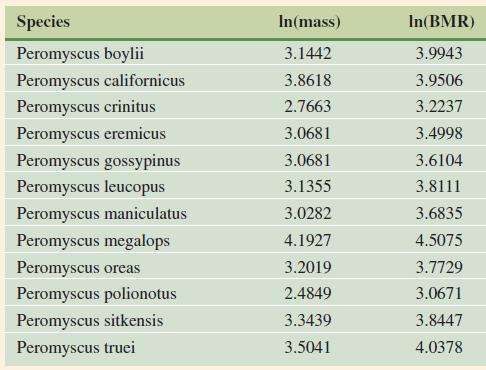
a. Plot ln(BMR) against ln(mass) using a graphing calculator. Does the relationship appear to be linear?
b. Find the least squares line for the data plotted in part a. Plot the line on the same axes as the data.
c. Calculate the mass and BMR for each species, and then find the best-fitting power function for these data. Plot this function on the same axes as the mass and BMR data.
d. What would you conclude about whether the deer mouse BMR can be modeled as a power function of the mass? What seems to be an approximate value of the power?
Step by Step Answer:

This question has not been answered yet.
You can Ask your question!


Calculus With Applications
ISBN: 9780321831101
10th Edition
Authors: Margaret L Lial, Raymond N Greenwell, Nathan P Ritchey
