

Gwartney et al. listed the following data relating the price of a monthly cellular bill (in dollars)
Question:
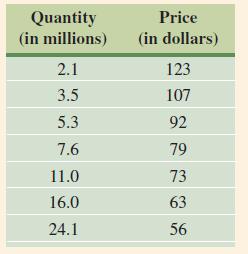
Gwartney et al. listed the following data relating the price of a monthly cellular bill (in dollars) and the demand (in millions of subscribers).
a. Using a graphing calculator, plot the natural logarithm of the price against the natural logarithm of the quantity. Does the relationship appear to be linear?
b. Find the best-fitting line to the natural logarithm of the data, as plotted in part a. Plot this line on the same axes as the data.
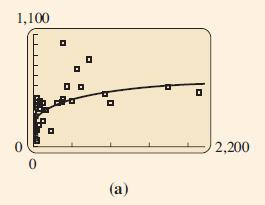
c. Plot the price against the quantity. What is different about the trend in these data from the trend in Figures 59(a) and 61(a)? What does this tell you about the exponent of the best-fitting power function for these data? What conclusions can you make about how demand varies with the price?
d. Find the best-fitting power function for the data plotted in part c. Verify that this function is equivalent to the least squares line through the logarithm of the data found in part b.
Figure 59a.

Figure 61a.
Step by Step Answer:
a The relationship of lnprice lnquantity appears to be a straight line b The best fit line obtained ...View the full answer


Calculus With Applications
ISBN: 9780321831101
10th Edition
Authors: Margaret L Lial, Raymond N Greenwell, Nathan P Ritchey
