

The enrollment in Head Start for some recent years is included in the table. (a) Plot the
Question:
The enrollment in Head Start for some recent years is included in the table.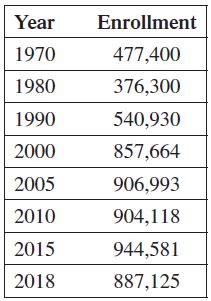
(a) Plot the points from the table using 0 for 1970, and so on.
(b) Use the quadratic regression feature of a graphing calculator to get a quadratic function that approximates the data. Graph the function on the same window as the scatterplot.
(c) Use cubic regression to get a cubic function that approximates the data. Graph the function on the same window as the scatterplot.
(d) Use the functions from parts (b) and (c) to predict the enrollment in Head Start in 2025.
(e) Which of the two functions in parts (b) and (c) appears to be a better fit for the data? Explain your reasoning.
Fantastic news! We've Found the answer you've been seeking!
Step by Step Answer:
a b y 95037t 2 12771t 383087 c y 30486t 3 22242...View the full answer

Answered By
Pushpinder Singh
Currently, I am PhD scholar with Indian Statistical problem, working in applied statistics and real life data problems. I have done several projects in Statistics especially Time Series data analysis, Regression Techniques.
I am Master in Statistics from Indian Institute of Technology, Kanpur.
I have been teaching students for various University entrance exams and passing grades in Graduation and Post-Graduation.I have expertise in solving problems in Statistics for more than 2 years now.I am a subject expert in Statistics with Assignmentpedia.com.
3+ Reviews
10+ Question Solved
Related Book For 

Question Posted:
