

The figure below shows the average price of silver for recent years. Let S(t) represent the average
Question:
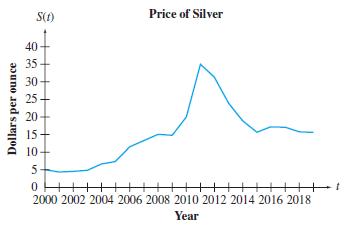
The figure below shows the average price of silver for recent years. Let S(t) represent the average price (in dollars per ounce) of silver for year t Source: macrotrends.com.
(a) Is S(t) a linear function?
(b) What is the independent variable?
(c) What is the dependent variable?
(d) What is the domain of the function?
(e) Estimate the range of the function.
(f) What was the average price per ounce in 2008?
(g) In what year was the average price $35 per ounce?
Fantastic news! We've Found the answer you've been seeking!
Step by Step Answer:
a No b Year t ...View the full answer

Answered By
Hillary Waliaulah
As a tutor, I am that experienced with over 5 years. With this, I am capable of handling a variety of subjects.
17+ Reviews
30+ Question Solved
Related Book For 

Question Posted:
