

The graph shows how the velocity of a baseball that was traveling at 40 miles per hour
Question:
The graph shows how the velocity of a baseball that was traveling at 40 miles per hour when it was hit by a Little League baseball player varies with respect to the weight of the bat.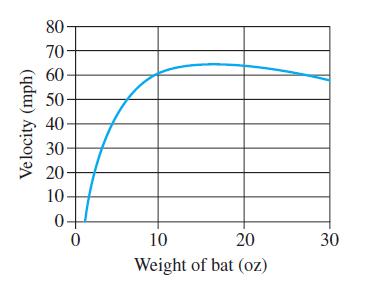
(a) Estimate and interpret the derivative for a 16-oz and 25-oz bat.
(b) What is the optimal bat weight for this player?
Fantastic news! We've Found the answer you've been seeking!
Step by Step Answer:
a The slope of the graph at 16 looks horizontal Thus the deri...View the full answer

Answered By
Brown Arianne
Detail-oriented professional tutor with a solid 10 years of experience instilling confidence in high school and college students. Dedicated to empowering all students with constructive feedback and practical test-taking strategies. Effective educator and team player whether working in a school, university, or private provider setting. Active listener committed to helping students overcome academic challenges to reach personal goals.
2+ Reviews
10+ Question Solved
Related Book For 

Question Posted:
