

The graph shows how the velocity of a baseball that was traveling at 90 miles per hour
Question:
The graph shows how the velocity of a baseball that was traveling at 90 miles per hour when it was hit by a Major League baseball player varies with respect to the weight of the bat.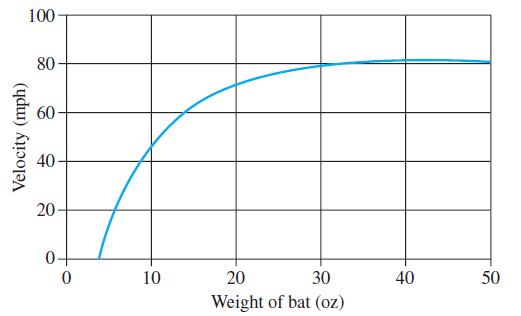
(a) Estimate and interpret the derivative for a 40-oz and 30-oz bat.
(b) What is the optimal bat weight for this player?
Fantastic news! We've Found the answer you've been seeking!
Step by Step Answer:
a At 40 oz the tangent looks horizontal thus the derivativ...View the full answer

Answered By
Utsab mitra
I have the expertise to deliver these subjects to college and higher-level students. The services would involve only solving assignments, homework help, and others.
I have experience in delivering these subjects for the last 6 years on a freelancing basis in different companies around the globe. I am CMA certified and CGMA UK. I have professional experience of 18 years in the industry involved in the manufacturing company and IT implementation experience of over 12 years.
I have delivered this help to students effortlessly, which is essential to give the students a good grade in their studies.
2+ Reviews
10+ Question Solved
Related Book For 

Question Posted:
