

The graph shows the money remaining in the Medicare Trust Fund at the end of the fiscal
Question:
The graph shows the money remaining in the Medicare Trust Fund at the end of the fiscal year.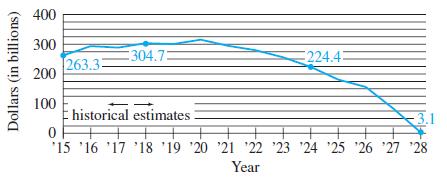
Find the approximate average rate of change in the trust fund for each time period.
(a) From 2015 to 2018
(b) From 2018 to 2028
Fantastic news! We've Found the answer you've been seeking!
Step by Step Answer:
a For the period 2015 to 2018 Increa...View the full answer

Answered By
Jinah Patricia Padilla
Had an experience as an external auditor in Ernst & Young Philippines and currently a Corporate Accountant in a consultancy company providing manpower to a 5-star hotel in Makati, Philippines, Makati Diamond Residences
120+ Reviews
150+ Question Solved
Related Book For 

Question Posted:
