

The incidence of the disease shingles increases with age, as shown by the following table. (a) Plot
Question:
The incidence of the disease shingles increases with age, as shown by the following table.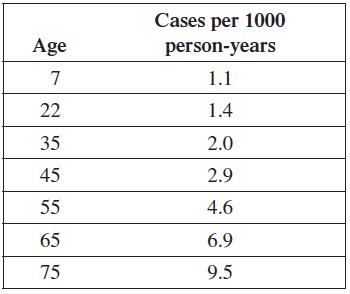 (a) Plot the data. Does fitting an exponential curve to the data seem reasonable?
(b) Use the data for 7 years and 75 years to find a function of the form ƒ(t) = C • ɑt that goes through these two points.
(c) Use your function from part (b) to predict the incidence of shingles for ages 22 and 45. How well do these predictions fit the data?
(d) If you have a graphing calculator or computer program with an exponential regression feature, use it to find an exponential function that approximately fits the data. How does this answer compare with the answer to part (b)?
Fantastic news! We've Found the answer you've been seeking!
Step by Step Answer:
a Yes fitting an exponential curve to the data seems reasonable b c f22 08811032 22 176 f45 ...View the full answer

Answered By
Muhammad Umair
I have done job as Embedded System Engineer for just four months but after it i have decided to open my own lab and to work on projects that i can launch my own product in market. I work on different softwares like Proteus, Mikroc to program Embedded Systems. My basic work is on Embedded Systems. I have skills in Autocad, Proteus, C++, C programming and i love to share these skills to other to enhance my knowledge too.
1+ Reviews
10+ Question Solved
Related Book For 

Question Posted:
