

The histogram shown represents the times taken, in minutes, for 115 men to complete a task. Two
Question:
The histogram shown represents the times taken, in minutes, for 115 men to complete a task.
Two men are selected at random from the group. Find the probability that the:
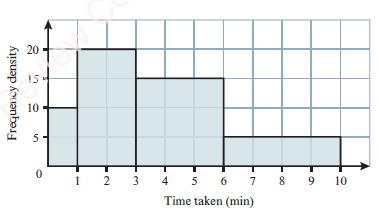
a. First man took less than 1 minute, given that he took less than 3 minutes
b. Second man took less than 6 minutes, given that the first man took less than 1 minute.
Fantastic news! We've Found the answer you've been seeking!
Step by Step Answer:
a First man took less than 1 minute given that he took less than 3 minutes Total number of men who t...View the full answer

Answered By
ABHISHEK KUMAR
I am doing pharm D 4th year which equals bachelor of pharmacy. I worked as tutor in a tution centre, photostudy and selected as q and a expert in Chegg. I also completed a bachelors degree in mathematics.
0 Reviews
10+ Question Solved
Related Book For 

Cambridge International AS & A Level Mathematics Probability & Statistics 1 Coursebook
ISBN: 9781108407304
1st Edition
Authors: Dean Chalmers, Julian Gilbey
Question Posted:
