

Using the data provided in Example 2-1, determine (a) the mean and variance, (b) the frequency as
Question:
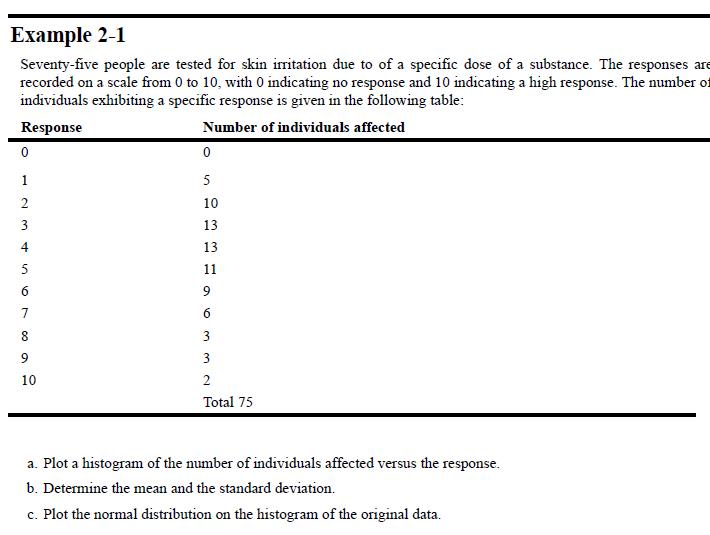
Using the data provided in Example 2-1, determine
(a) the mean and variance,
(b) the frequency as a function of the response, and
(c) the number affected as a function of the response. Also,
(d) show graphs for the frequency and number affected.
Fantastic news! We've Found the answer you've been seeking!
Step by Step Answer:

Answered By
Muhammad Ghyas Asif
It is my obligation to present efficient services to my clients by providing a work of quality, unique, competent and relevant. I hope you have confidence in me and assign me the order and i promise to follow all the instructions and keep time.
109+ Reviews
203+ Question Solved
Related Book For 
Chemical Process Safety Fundamentals With Applications
ISBN: 9780134857770
4th Edition
Authors: Daniel A. Crowl, Joseph F. Louvar
Question Posted:
