

The reaction A+B2C is carried out in a packed-bed reactor. Match the following temperature and conversion profiles
Question:
The reaction A+B←→2C is carried out in a packed-bed reactor. Match the following temperature and conversion profiles for the four different heat-exchange cases: adiabatic, constant Ta, cocurrent exchange, and countercurrent exchange.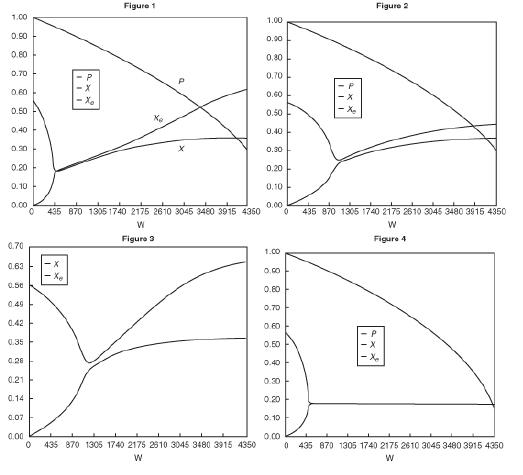
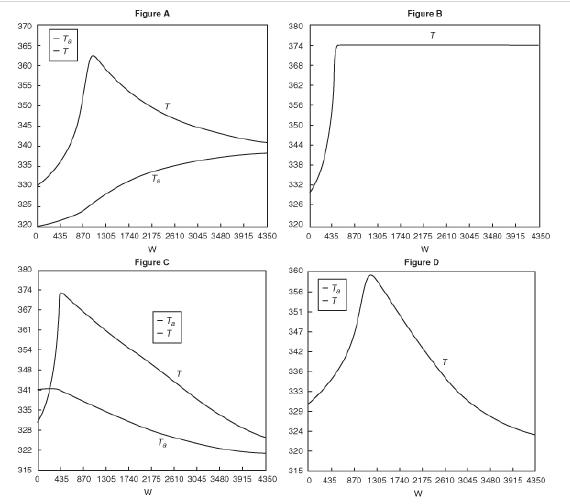
For the different heat-exchange cases that occurs in a reaction carried out in a packed-bed reactor six different trend graphs are shown. The first two graphs have their horizontal axis representing W and ranges from 0 to 4350 and the vertical axis ranges from 0.00 to 1.00. The two graphs have three trend curves each representing P, X Subscript e, and X. The third graph has its horizontal axis representing W and ranges from 0 to 4350 and the vertical axis ranges from 0.00 to 0.70. There are two trend curves on the graph each representing X and X Subscript e. The third graph has its horizontal axis representing W and ranges from 0 to 4350 and the vertical axis ranges from 0.00 to 0.70. There are two trend curves on the graph each representing X and X Subscript e. The fourth graph has its horizontal axis representing W and ranges from 0 to 4350 and the vertical axis ranges from 0.00 to 1.00. There are three trend curves on the graph each representing P, X and X Subscript e. The fifth graph has the horizontal axis representing W and ranges from 0 to 4350 and the vertical axis ranges from 320 to 370. There are two trend curves drawn on the graph. The trend curve representing T begins at the value 330 on the y-axis when W is 0 and goes up to the highest value of 375 on the y-axis when W is 870. It then drops down to the value of 340 when W is 4350. The trend curve representing T Subscript a begins with a value of 320 on the y-axis when W is 0 and then goes up and joins T at the value of 340 when W is 4350. The sixth graph has the horizontal axis representing W and ranges from 0 to 4350 and the vertical axis ranges from 320 to 380. There is a trend curve drawn on the graph. The trend curve representing T begins at the value 330 on the y-axis when W is 0 and goes up to the highest value of 374 on the y-axis when W is 870. From there the y-axis value of the curve remains constant while the final W value is 4350. The seventh graph has the horizontal axis representing W and ranges from 0 to 4350 and the vertical axis ranges from 315 to 380. There are two trend curves drawn on the graph. The trend curve representing T begins at the value 330 on the y-axis when W is 0 and goes up to the highest value of 373 on the y-axis when W is 870. It then drops down to the value of 328 when W is 4350. The trend curve representing T Subscript a begins at the value 341 on the y-axis when W is 0 and then goes down and joins T at the value of 328 when W is 4350. The eighth graph has the horizontal axis representing W and ranges from 0 to 4350 and the vertical axis ranges from 315 to 360. There is a trend curve drawn on the graph. The trend curve representing T begins at the value 330 on the y-axis when W is 0 and goes up to the highest value of 359 on the y-axis when W is 870. From there the curve drops down to the value of 324 while the final W value is 4350. Note that the values are approximate.
(a) Figure 1 matches Figure ___
(b) Figure 2 matches Figure ___
(c) Figure 3 matches Figure ___
(d) Figure 4 matches Figure ___
Step by Step Answer:
a Figure 1 matches Fig...View the full answer


