

The accompanying graph shows the heating curves for one mole each of substances A and B, at
Question:
The accompanying graph shows the heating curves for one mole each of substances A and B, at one atmosphere pressure.
(a) Give the melting and boiling points for each substance.
(b) Which substance has the greater enthalpy of vaporization?
(c) Which substance has a greater molar heat capacity in the liquid phase?
(d) Which substance has the stronger intermolecular forces of attraction?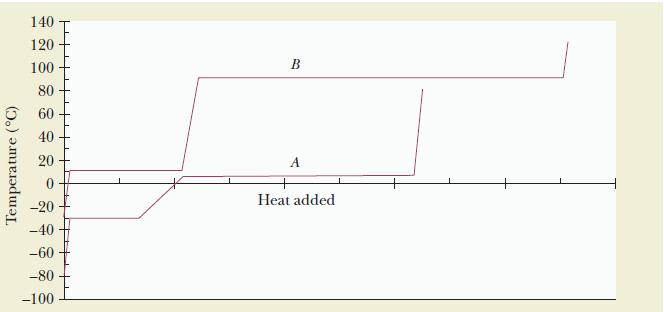
Strategy
Refer to the heating curve for approximate melting and boiling points. The enthalpy of vaporization is related to the length of the horizontal vaporization line, whereas the slope of the temperature-change segments is related to the heat capacity.
Fantastic news! We've Found the answer you've been seeking!
Step by Step Answer:
a Each heating curve has two plateaus The first occurs when the substance melts and the second occur...View the full answer

Answered By
Rehab Rahim
I am well versed in communicating and teaching in areas of all business subjects. I have helped many students in different ways from answering answers to writing their academic papers.
1+ Reviews
10+ Question Solved
Related Book For 
Chemistry Principles And Practice
ISBN: 9780534420123
3rd Edition
Authors: Daniel L. Reger, Scott R. Goode, David W. Ball
Question Posted:
