

Exercises 8991 present data in the form of tables. For each data set shown by the table,
Question:
Exercises 89–91 present data in the form of tables. For each data set shown by the table,
a. Create a scatter plot for the data.
b. Use the scatter plot to determine whether an exponential function, a logarithmic function, or a linear function is the best choice for modeling the data.
Percentage of Moderate Alcohol Users in the United States (Not Binge or Heavy Drinkers)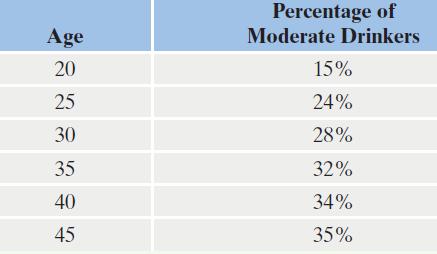
Fantastic news! We've Found the answer you've been seeking!
Step by Step Answer:
a b A logarithmic function appears to be th...View the full answer

Answered By
Munibah Munir
I've done MS specialization in finance’s have command on accounting and financial management. Forecasting and Financial Statement Analysis is basic field of my specialization. On many firms I have done real base projects in financial management field special forecasting. I have served more than 500 Clients for more than 800 business projects, and I have got a very high repute in providing highly professional and quality services.I have capability of performing extra-ordinarily well in limited time and at reasonable fee. My clients are guaranteed full satisfaction and I make things easy for them. I am capable of handling complex issues in the mentioned areas and never let my clients down.
467+ Reviews
648+ Question Solved
Related Book For 

Question Posted:
