

The figure shows world population projections through the year 2150. The data are from the United Nations
Question:
The figure shows world population projections through the year 2150. The data are from the United Nations Family Planning Program and are based on optimistic or pessimistic expectations for successful control of human population growth. Suppose that you are interested in modeling these data using exponential, logarithmic, linear, and quadratic functions. Which function would you use to model each of the projections? Explain your choices. For the choice corresponding to a quadratic model, would your formula involve one with a positive or negative leading coefficient? Explain.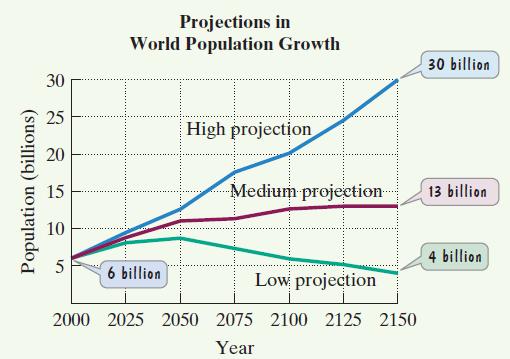
Fantastic news! We've Found the answer you've been seeking!
Step by Step Answer:

Answered By
Amos Kiprotich
I am a wild researcher and I guarantee you a well written paper that is plagiarism free. I am a good time manager and hence you are assured that your paper will always be delivered a head of time. My services are cheap and the prices include a series of revisions, free referencing and formatting.
15+ Reviews
21+ Question Solved
Related Book For 

Question Posted:
