

Shown, again, in the following table is world population, in billions, for seven selected years from 1950
Question:
Shown, again, in the following table is world population, in billions, for seven selected years from 1950 through 2010. Using a graphing utility’s logistic regression option, we obtain the equation shown on the screen.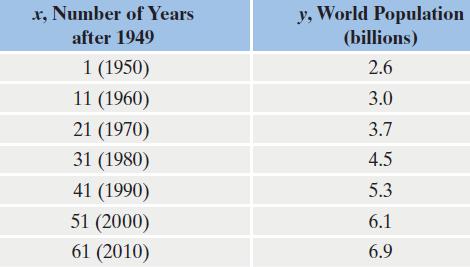
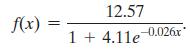
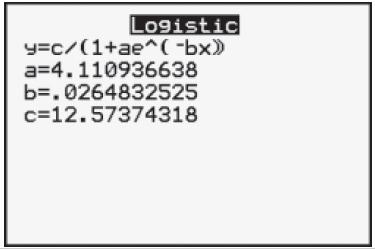 We see from the calculator screen at the bottom of the previous page that a logistic growth model for world population, f(x), in billions, x years after 1949 is
 Use this function to solve Exercises 38–42.
When did world population reach 7 billion?
Fantastic news! We've Found the answer you've been seeking!
Step by Step Answer:
1257 1411e0026x 1257 1411e0026x 1257 1257 557 557 ...View the full answer

Answered By
John Kimutai
I seek to use my competencies gained through on the job experience and skills learned in training to carry out tasks to the satisfaction of users. I have a keen interest in always delivering excellent work
11+ Reviews
24+ Question Solved
Related Book For 

Question Posted:
