

The bar graph in the next column shows the percentage of Americans who used cigarettes, by ethnicity,
Question:
The bar graph in the next column shows the percentage of Americans who used cigarettes, by ethnicity, in 1985 and 2005. For each of the groups shown, cigarette use has been linearly decreasing.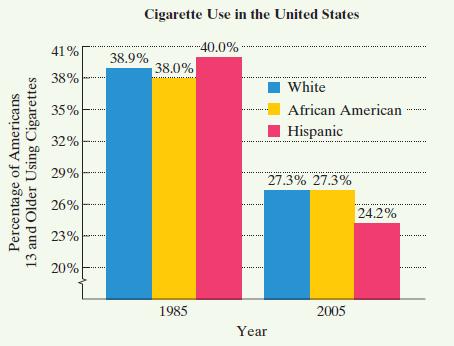
a. In 1985, 38% of African Americans used cigarettes. For the period shown by the graph, this has decreased at an average rate of 0.54% per year. Write a function that models the percentage of African Americans who used cigarettes, y, x years after 1985.
b. The function 0.79x + y = 40 models the percentage of Hispanics who used cigarettes, y, x years after 1985. Use this model and the model you obtained in part (a) to determine the year during which cigarette use was the same for African Americans and Hispanics. What percentage of each group used cigarettes during that year?
Step by Step Answer:
a y 054x 38 b Using substitution 079x y 40 y 079x054x38 ...View the full answer


