

The bar graph shows changes in the percentage of college graduates for Americans ages 25 and older
Question:
The bar graph shows changes in the percentage of college graduates for Americans ages 25 and older from 1990 to 2010. Exercises 61–62 involve developing arithmetic sequences that model the data.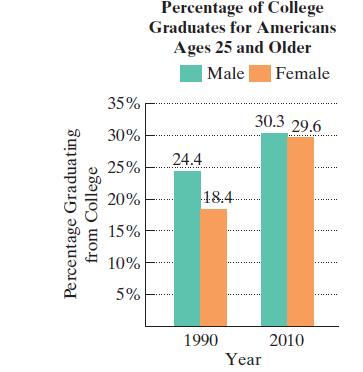
In 1990, 18.4% of American women ages 25 and older had graduated from college. On average, this percentage has increased by approximately 0.6 each year.
a. Write a formula for the nth term of the arithmetic sequence that models the percentage of American women ages 25 and older who had graduated from college n years after 1989.
b. Use the model from part (a) to project the percentage of American women ages 25 and older who will be college graduates by 2019.
Fantastic news! We've Found the answer you've been seeking!
Step by Step Answer:
a b an a...View the full answer

Answered By
Charles mwangi
I am a postgraduate in chemistry (Industrial chemistry with management),with writing experience for more than 3 years.I have specialized in content development,questions,term papers and assignments.Majoring in chemistry,information science,management,human resource management,accounting,business law,marketing,psychology,excl expert ,education and engineering.I have tutored in other different platforms where my DNA includes three key aspects i.e,quality papers,timely and free from any academic malpractices.I frequently engage clients in each and every step to ensure quality service delivery.This is to ensure sustainability of the tutoring aspects as well as the credibility of the platform.
2+ Reviews
10+ Question Solved
Related Book For 

Question Posted:
