

The bar graph shows the differences among political identification groups on the Implicit Association Test that measure
Question:
The bar graph shows the differences among political identification groups on the Implicit Association Test that measure levels of racial prejudice. Higher scores indicate stronger bias.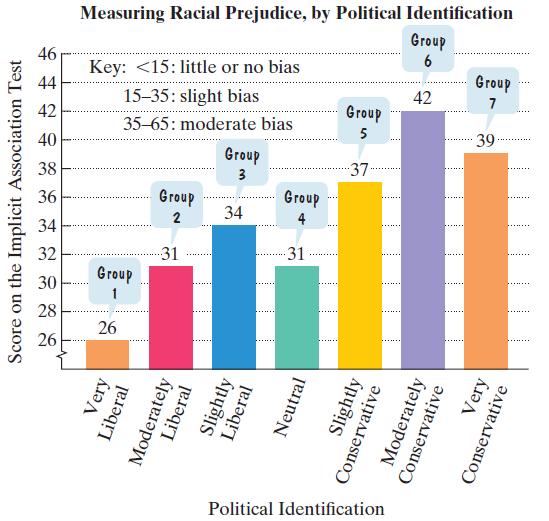
a. The data can be described by the following polynomial model of degree 3: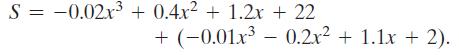
In this polynomial model, S represents the score on the Implicit Association Test for political identification group x. Simplify the model.
b. Use the simplified form of the model from part (a) to find the score on the Implicit Association Test for the slightly conservative political identification group. Does the model underestimate or overestimate the score displayed by the bar graph? By how much?
Fantastic news! We've Found the answer you've been seeking!
Step by Step Answer:
a b S 002x 04x 1...View the full answer

Answered By
Mamba Dedan
I am a computer scientist specializing in database management, OS, networking, and software development. I have a knack for database work, Operating systems, networking, and programming, I can give you the best solution on this without any hesitation. I have a knack in software development with key skills in UML diagrams, storyboarding, code development, software testing and implementation on several platforms.
49+ Reviews
119+ Question Solved
Related Book For 

Question Posted:
